Problem
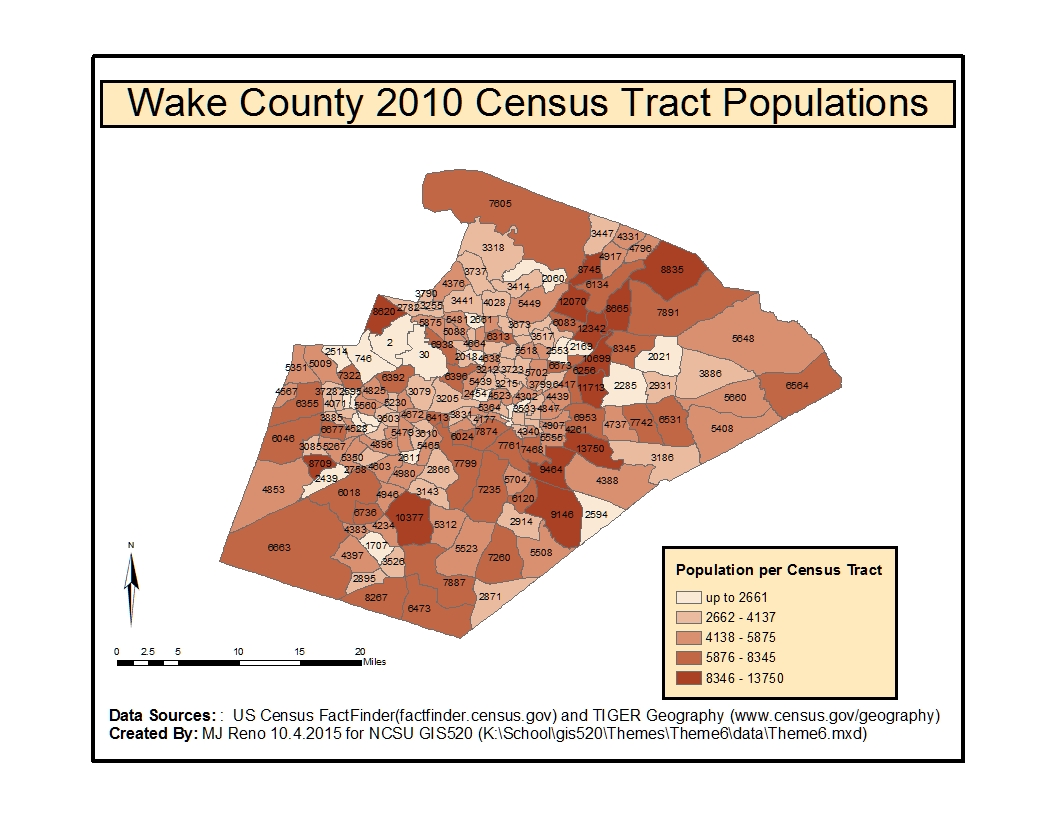
As an Office of State Human Resources GIS Analyst, I am involved in an effort to develop a set of maps based on U.S. Census data for a range of decision making activities in Wake County, NC. The current map of interest needs to show 2010 populations for Wake County census tracts and is needed to help interpret other 2010 census related data. The File downloaded was a 2010 Geographic Identifiers Summary File and the field represented is a census tract summary of VD072 Population Count (100%).
Analysis procedures
Strategies: 2010 population related data and Wake County shapefiles will be downloaded from the U.S. Census Bureau websites. The tabular data and map geographies must be ensured to match and in this case that means they are 2010 data associated with Wake County census tracts. The shapefiles and tabular data will be imported into ArcMap, where they can be associated and displayed in a meaningful way.
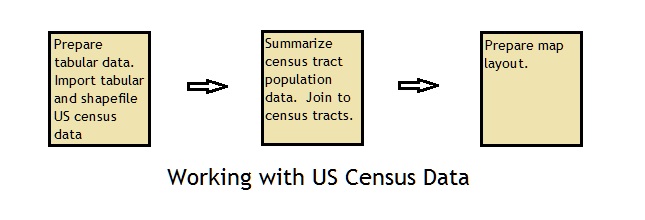
Methods: 2010 tabular population data for Wake County NC at block group resolution and a shapefile for 2010 Wake County census tracts were downloaded from the US Census Bureau website. The tabular csv file was converted to an Excel 97-2003 Workbook file. The file was edited to conform to ArcMap expectations with regard to field name. The tabular data and shapefile was imported in ArcMap. The shapefile census tract table String field was converted to a double field by adding a new double field and utilizing the Field Calculator tool. The tabular data was summarized on census tract so that block group populations associated with each tract were summed. The tabular table was then joined to the shapefile table on the double field that represented the census tract Id. A presentation was created to show census tract population in one of five classes.
Results
Result: 2010 Wake County Census Tract Populations:
Application and Reflection
Problem Description: Considering the amount of data and map layers available at the US Census Bureau site there are many, many potential applications. The data for example could be used to study poverty distributions at the census tract level for cities of comparable size, say 500,000-1M people, nationally.
Data Needed: US Census Bureau tabular and shapefile data for compared cities.
Analysis Procedures: Studies such as these could tie in to how different cities are handling policies related to those below the poverty line and what impact those polices have on where they live and the resources that are thus available to them.