Problem
An industrial extension job survey has been done and the results tabulated for various purposes including the reporting of localized job creation statistics to various districts in North Carolina. In particular, state Senators and state House members are interested in the job creation data for their data of interest. This is a general request for all districts, however, and so the problem is to take the tabular data that contains job creation statistics associated with zip codes and translate that to meaningful presentations of created jobs in each NC House and Senate district.
Analysis procedures
Strategies: This problem is largely solved in the ArcMap utilizing common strategies to associate data in different structures. The survey results are stored in an xls (Excel) file and that data must be associated appropriately with NC House and Senate districts. The districts themselves will be obtained from NCSU’s GIS library as the shapefiles senate.shp and house.shp. A relationship needs to be built between the job creation statistics, which are associated with zip codes, and the political districts. To do this North Carolina zip code points are needed and for this the “USA Zip Code Points” layer package is used from the ArcGIS web site. The general strategy will be to associate the job statistics data in the spreadsheet with zip code points from the layer package, and then to spatially join these zip code points to the House and Senate districts that contain them.
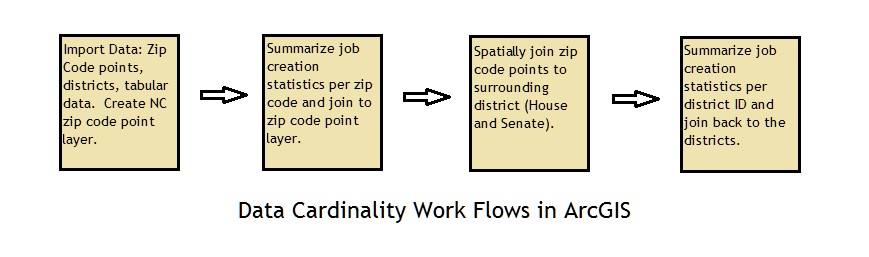
Methods: Initially, the xls data, the appropriate district shapefile (senate.shp or house.shp) and the Zip Code Point layer file was added to a new ArcMap object. The Zip Code layer contained points for the entire country so initially a new shapefile was created containing only NC Zip Code points. A new field was added to the NC Zip Code points table with a type double and the existing text Zip Code field was converted to the new double field with the field calculator tool.
Next, the Zip Code type double field in the xls file was summarized and the EMPLOY_SUM field was summed. This field in a single record represents a number of jobs that was created by a particular company. By summing on the Zip Code filed, all identical Zip Codes were condensed into a single record and the values in EMPLOY_SUM for each of the individual records were added to generate a cumulative sum of jobs created for that Zip Code.
The NC Zip Codes point features table was now joined to the summarized Zip Code job creation data table. This join, which was executed to keep matching records only, associated the summarized job creation data to spatial zip code point locations in the feature. Now a spatial join was done with the target layer as a district (House or Senate) and zip code points as the join feature. The match was specified to so that the target feature contains the join feature and as each district could contain more than one point the operation was specified as “one to many”.
The resulting spatial join resulted in certain districts being represented in more than one record when multiple zip code points were within its boundary. The table was summarized on the appropriate district Id (e.g. HOUSE_ID) and again, the data associated with the original EMPLOY_SUM field in the original xls file was summed. This generated a new table that contained one record for each district ID and a sum of all jobs created within that district. To display this information, the original district feature layer (house or senate) was joined back this table, creating an association in the map between the district and summed created jobs within it.
Results
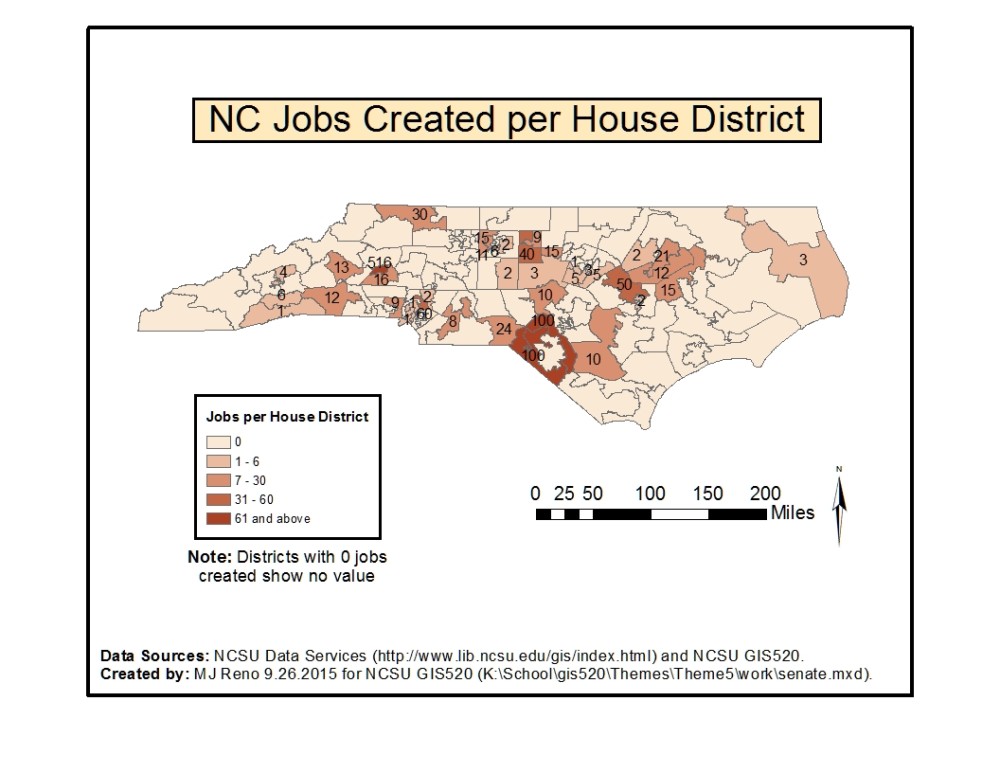
Result: Jobs created per House District:
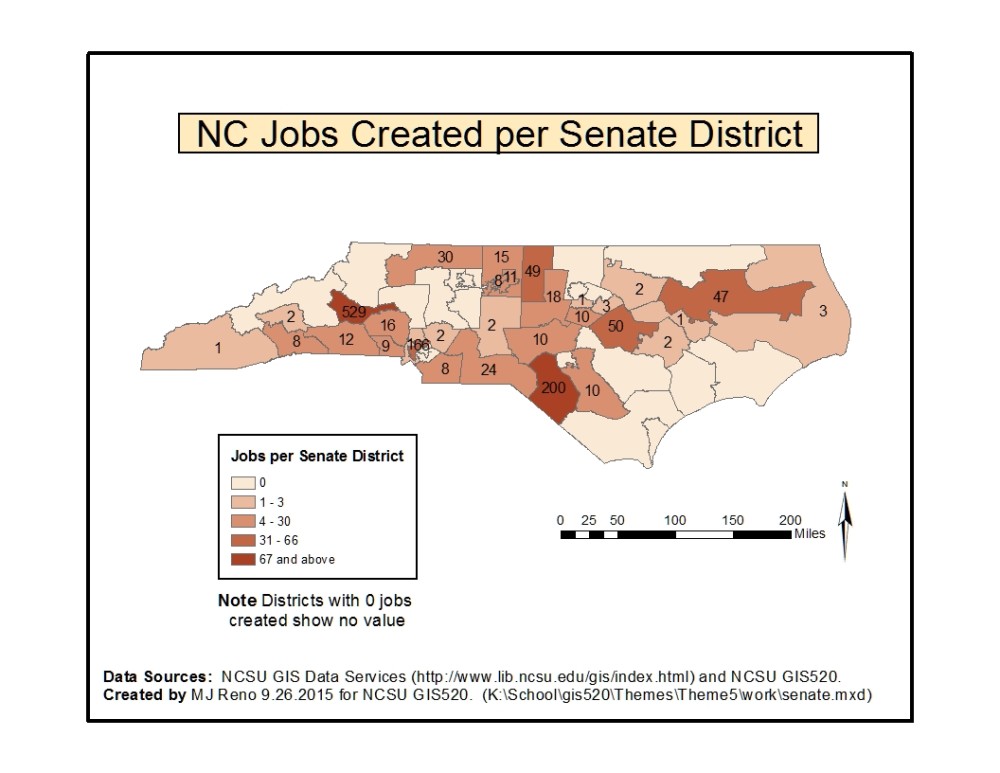
Result: Jobs created per Senate District:
Application and Reflection
Problem Description: Consider a government agency that has gathered demographic data through polling and has tabulated that information in a spreadsheet that now lists results according to zip code. The agency now wants to generate maps showing relationships between the data and geography, particularly climate zones which have been defined and mapped in a shapefile at the national level.
Data Needed: Tabulated demographic data associated with zip codes.
Analysis Procedures: The relevant demographic statistics are summarized per zip code, associated with zip code points via a join, and spatially joined to climate zones via a spatial join.