Turning Data into Information Using ArcGIS 10.0 Module 3: Working with measurements
Problem: Analysis is often complex. Measurements of all sorts can be taken or statistically generated but then the task of answering questions begins, often requiring the optimization of many variables across a given area. This module demonstrates how multiple numeric variables can be independently optimized and then overlaid to identify a final solution. In this case optimizations are done on a land area to define the best locations for a vineyard.
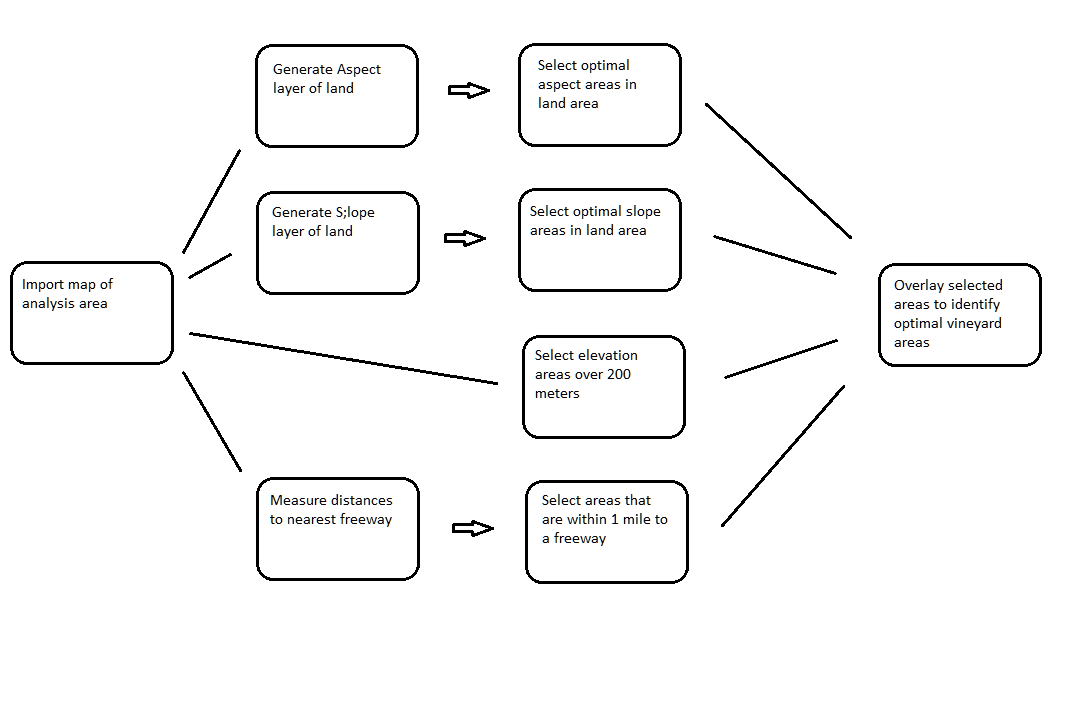
Analysis Procedures: A geographic region is available for vineyard development. Four different variables, each expected to correlate with potential success of the vineyard, are considered independently. Each of the variables is numeric in value and after values are mapped across the region (for each) a boolean test is applied to each, again independently. This produces a raster layer for each variable which maps to 1 (success, passes the test) or 0 (fails) for the region. Finally each of the four raster layers is overlaid and the cells that have a value of 1 for each layer are mapped to a new layer which corresponds to a “best fit” location. The four variables considered are aspect, slope, elevation and distance to a freeway.
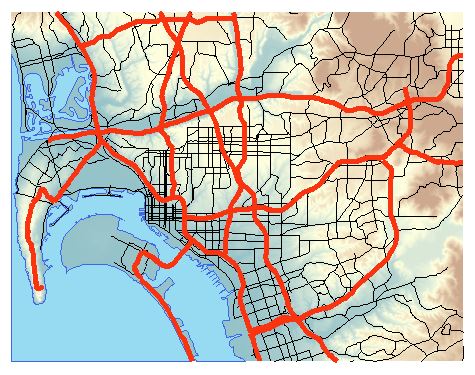
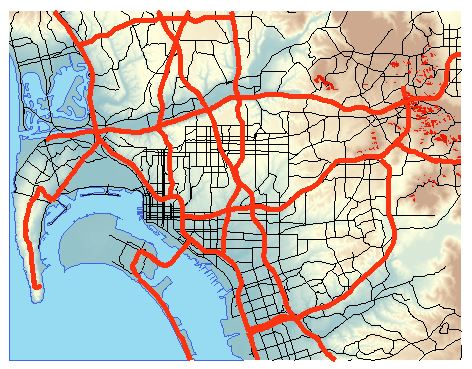
Results: The initial map of the region is shown here:
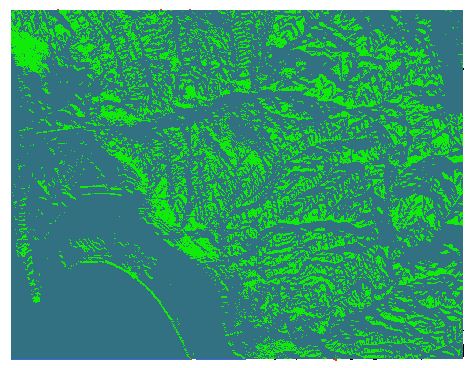
A raster elevation layer is used to generate a raster aspect layer using the Aspect Spatial Analyst tool. To this aspect layer is applied the boolean condition that tests each cell for an aspect greater than or equal to 157.5 AND less than and equal to 247.5, a range which is correlated with greater daily maximum temperature. Cells that meet this condition are assigned 1 (green) and cells that don’t meet the condition are assigned 0 (blue-grey):
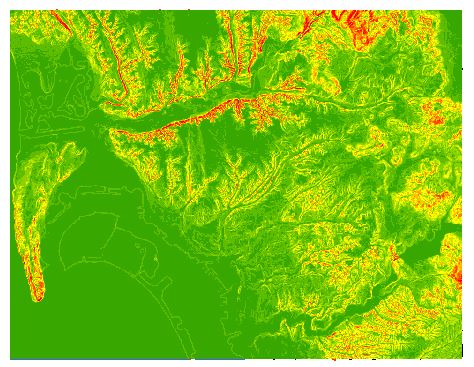
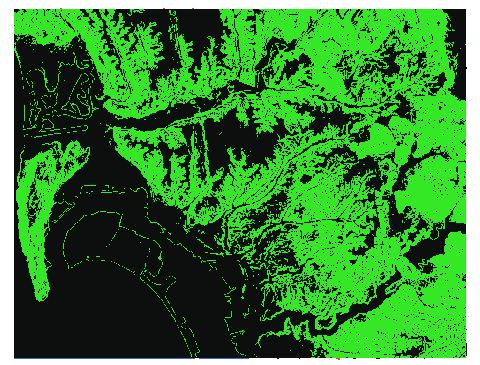
The raster elevation layer is now used to generate a raster slope layer using the Slope Spatial Analyst tool (left image, below). To this slope layer is applied the boolean condition that tests each cell for a slope greater than or equal to 1.5 AND less than and equal to 15, a range which is correlated with optimum growing conditions with respect to slope. Cells that meet this condition are assigned 1 (green) and cells that don’t meet the condition are assigned 0 (dark blue):
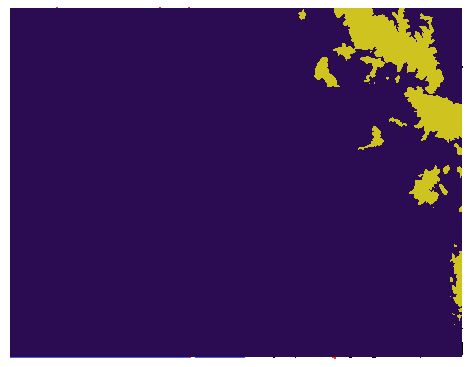
The raster elevation layer is now used to directly test for elevations greater than 200 metres using the Greater Than Spatial Analyst tool. Raster cells that meet the condition are assigned 1 (yellow here) and those that don’t are assigned 0 (dark blue).
A Euclidean Distance tool is now used to calculate the distance from each cell to the nearest freeway (contained in a Freeways layer). Each raster cell in the layer now contains a value associated with its proximity to the nearest freeway. Once more a boolean tool, Less Than Equal, is used to test each cell for a value less than or equal to 5280 feet, or 1 mile. Those cells that meet the condition are assigned 1 (purple here) and those that don’t are assigned 0 (black).

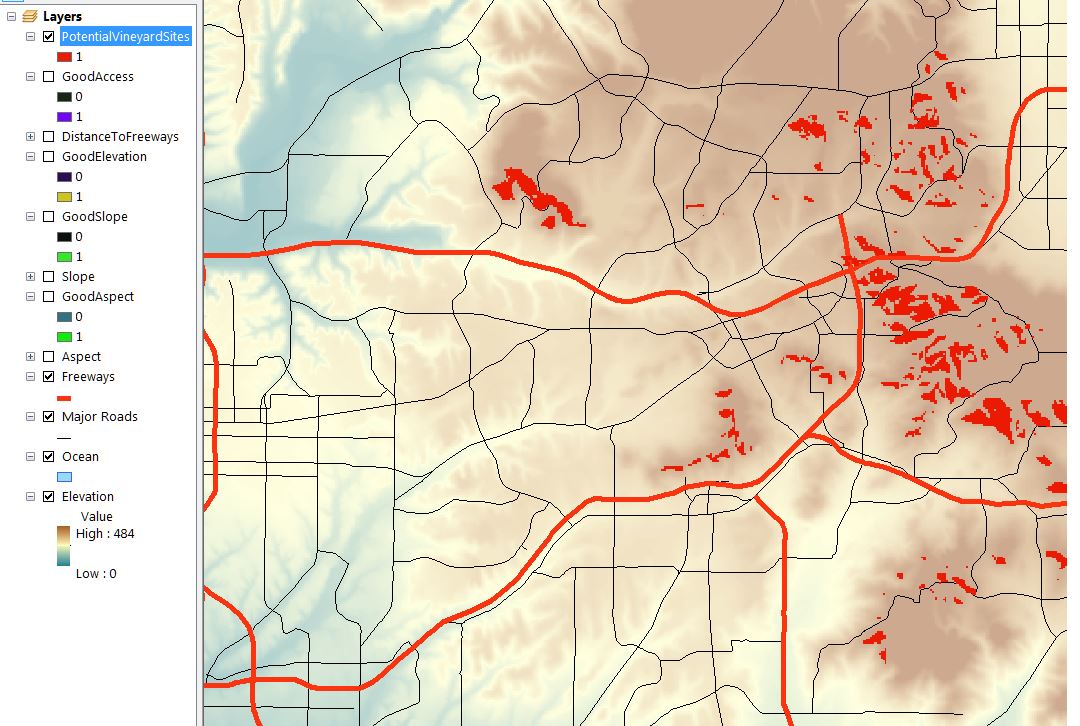
All four boolean layers are tested together using the Raster Calculator tool. The cells in all of the layers line up and now only cells that contain ‘1’ for each of the four tests outlined above are assigned ‘1’ in the new layer- a zero in any of the four layers translates to a 0 in that cell for this cumulative layer. The final layer is shown on top of the original map, left, and zoomed, right. The red areas are those that have been identified as optimum for the vineyard.
Application & Reflection
Problem description: Consider selecting a site for a new outdoor retail center.
Data needed: Optimized variables may include those such as a minimal continuous block of land that is both within a budget constraint restriction, size considerations, and also can achieve the correct development zoning. Furthermore, general geographic considerations of the parcel (which ties into cost related to development), proximity to population centers and access to major roadways will all be considerations.
Analysis procedures: Independently each of these factors can be considered, data generated, and the layers scaled. The layers can then be overlaid, giving the greatest weight to the most important factors, and the best locations pushed forward for consideration.