Problem
A 4-band true-color and color-infrared 1 foot resolution aerial image has been generated for Black Water National Wildlife Refuge and resident GIS Analysts are asked to perform a supervised classification on the image in order to establish land cover types. This is an exploratory activity geared towards establishing a methodology for the entire refuge which will ultimately inform decisions on a comprehensive management plan.
Analysis procedures
Strategies: A multi-band tif image, provided by NCSU, is used for the classification. The image has RGB true color bands and a fourth color-infrared band. ArcMap image classification tools are used to define sample sets for each of the six land cover types (forest, field, barren, developed, wetland and water) shown in the image after which a supervised classification is performed. This process is iterated, each time expanding the sample training set in types requiring improved classification, until good results are obtained.
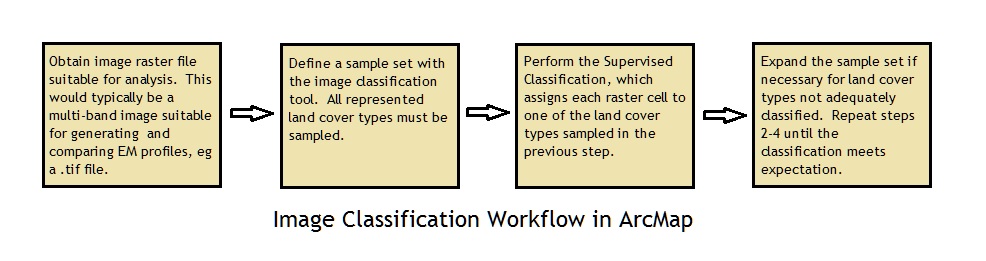
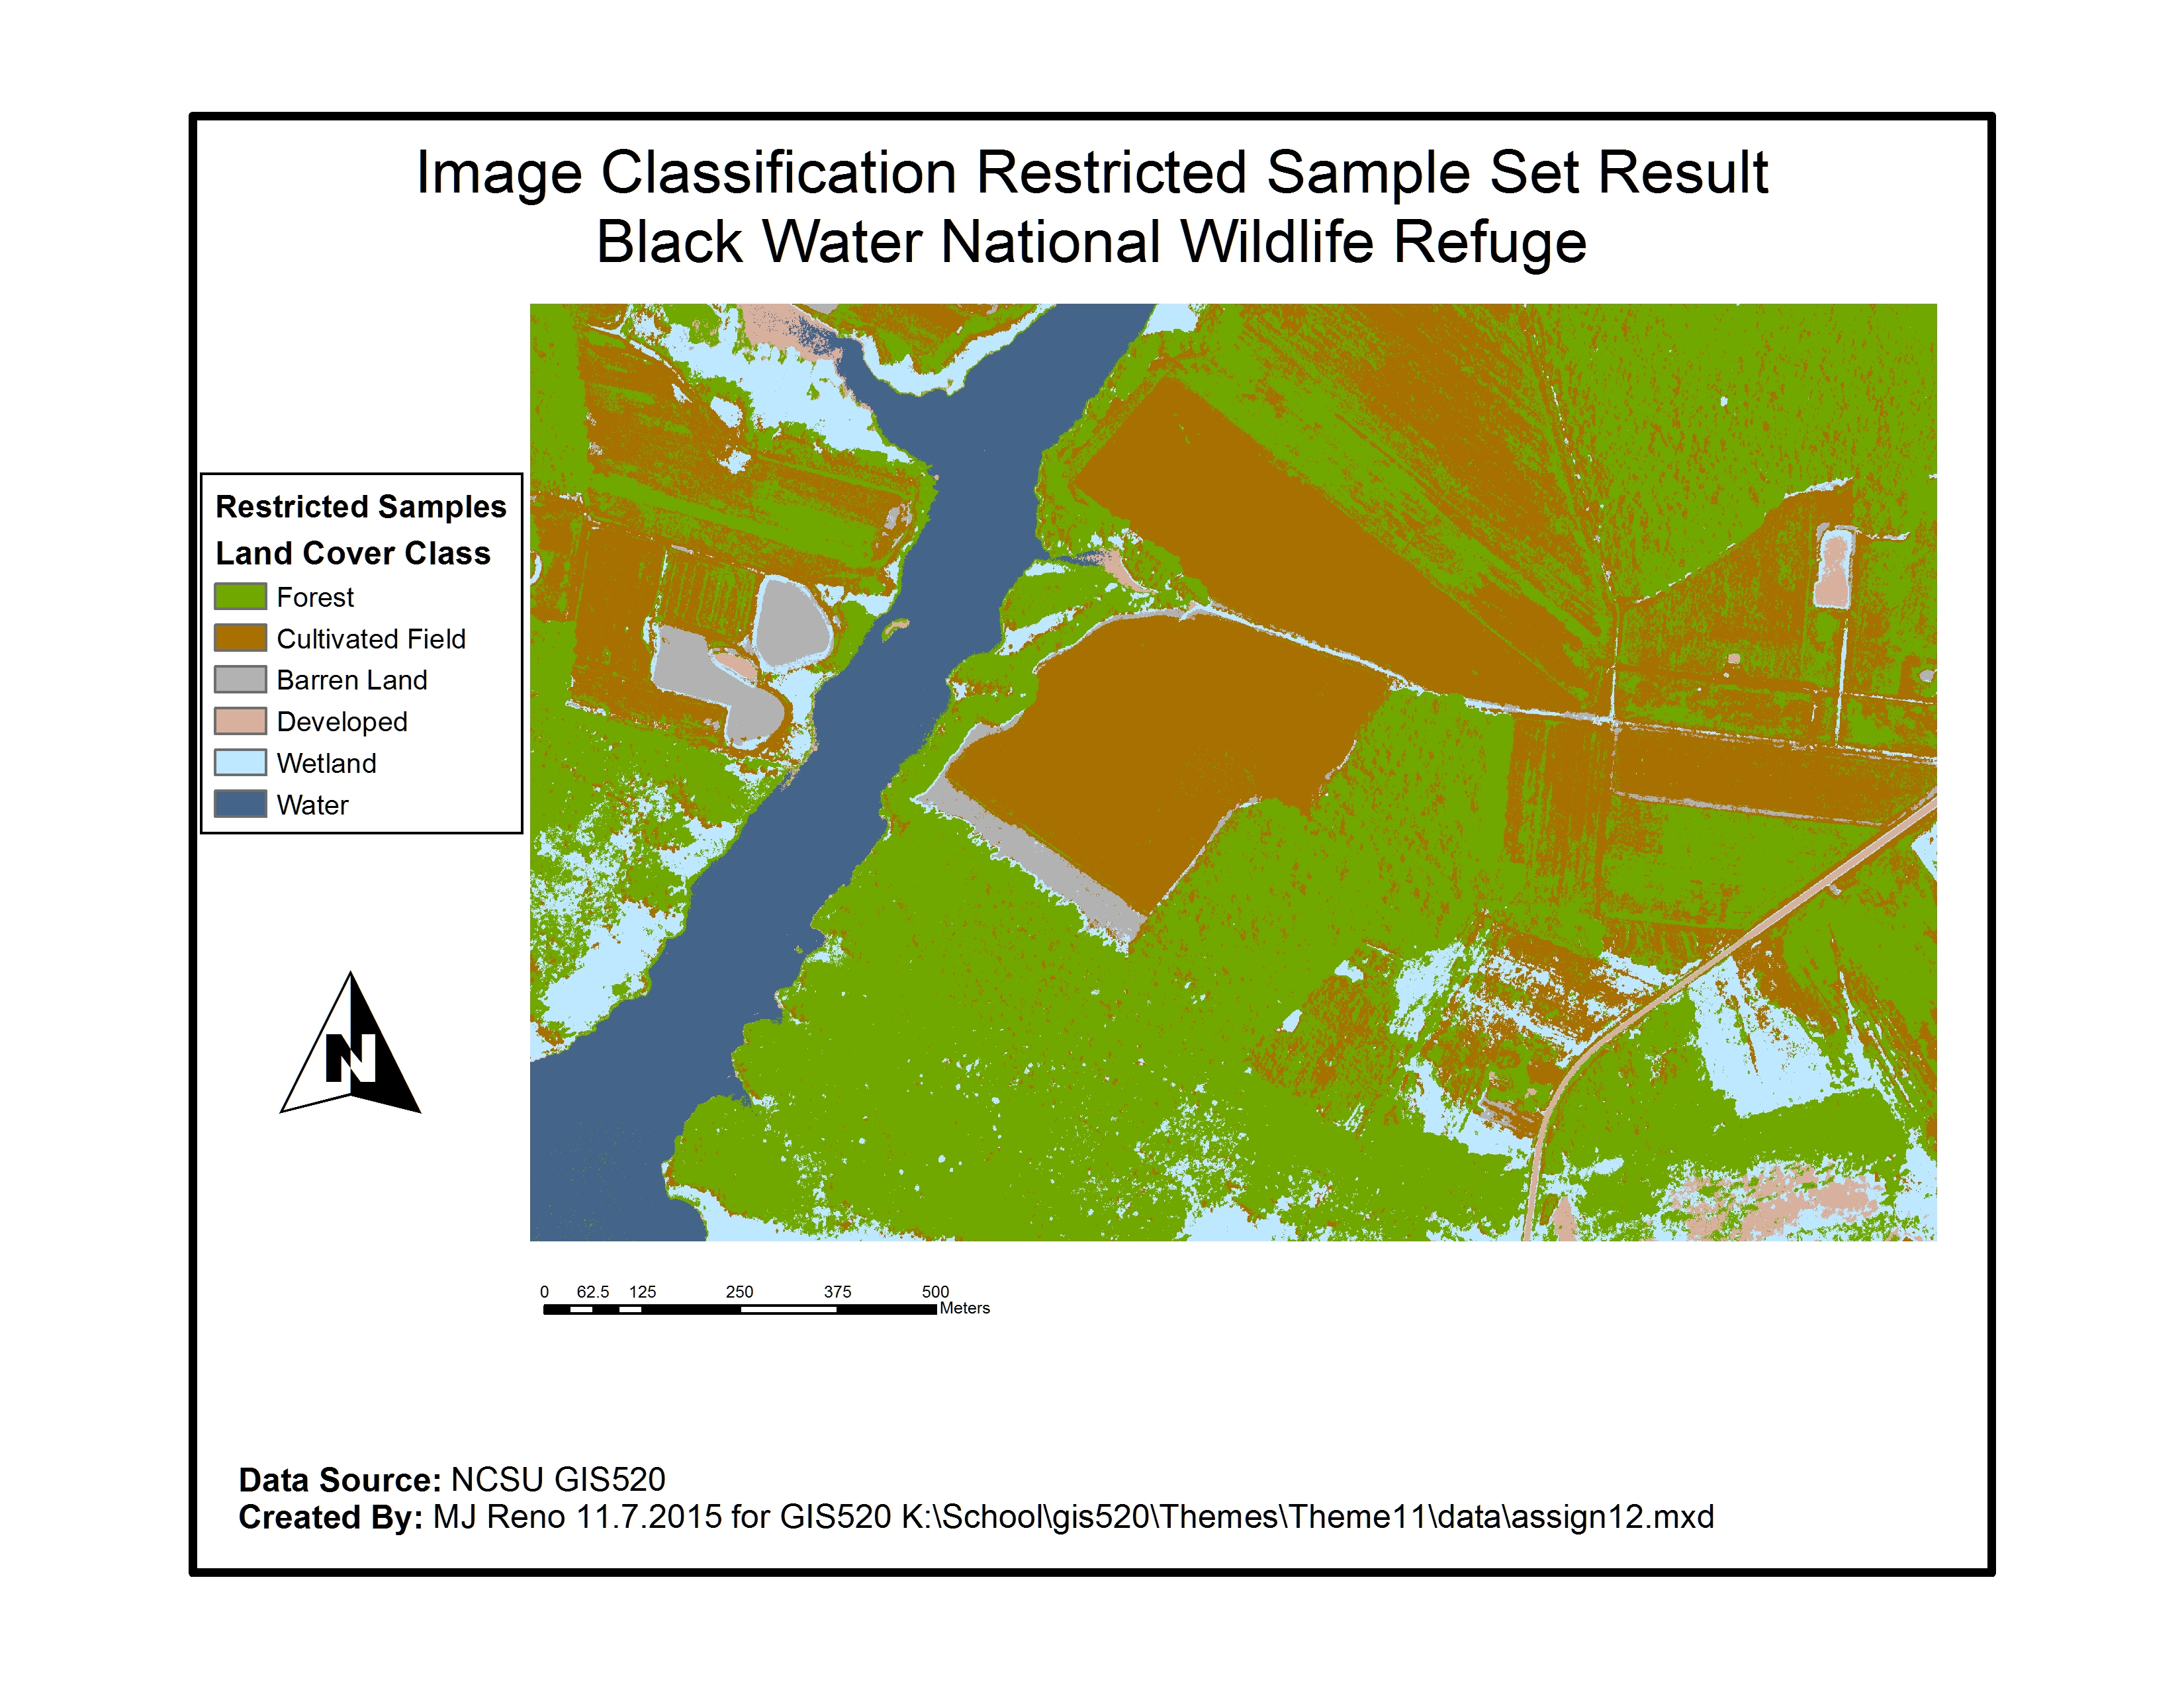
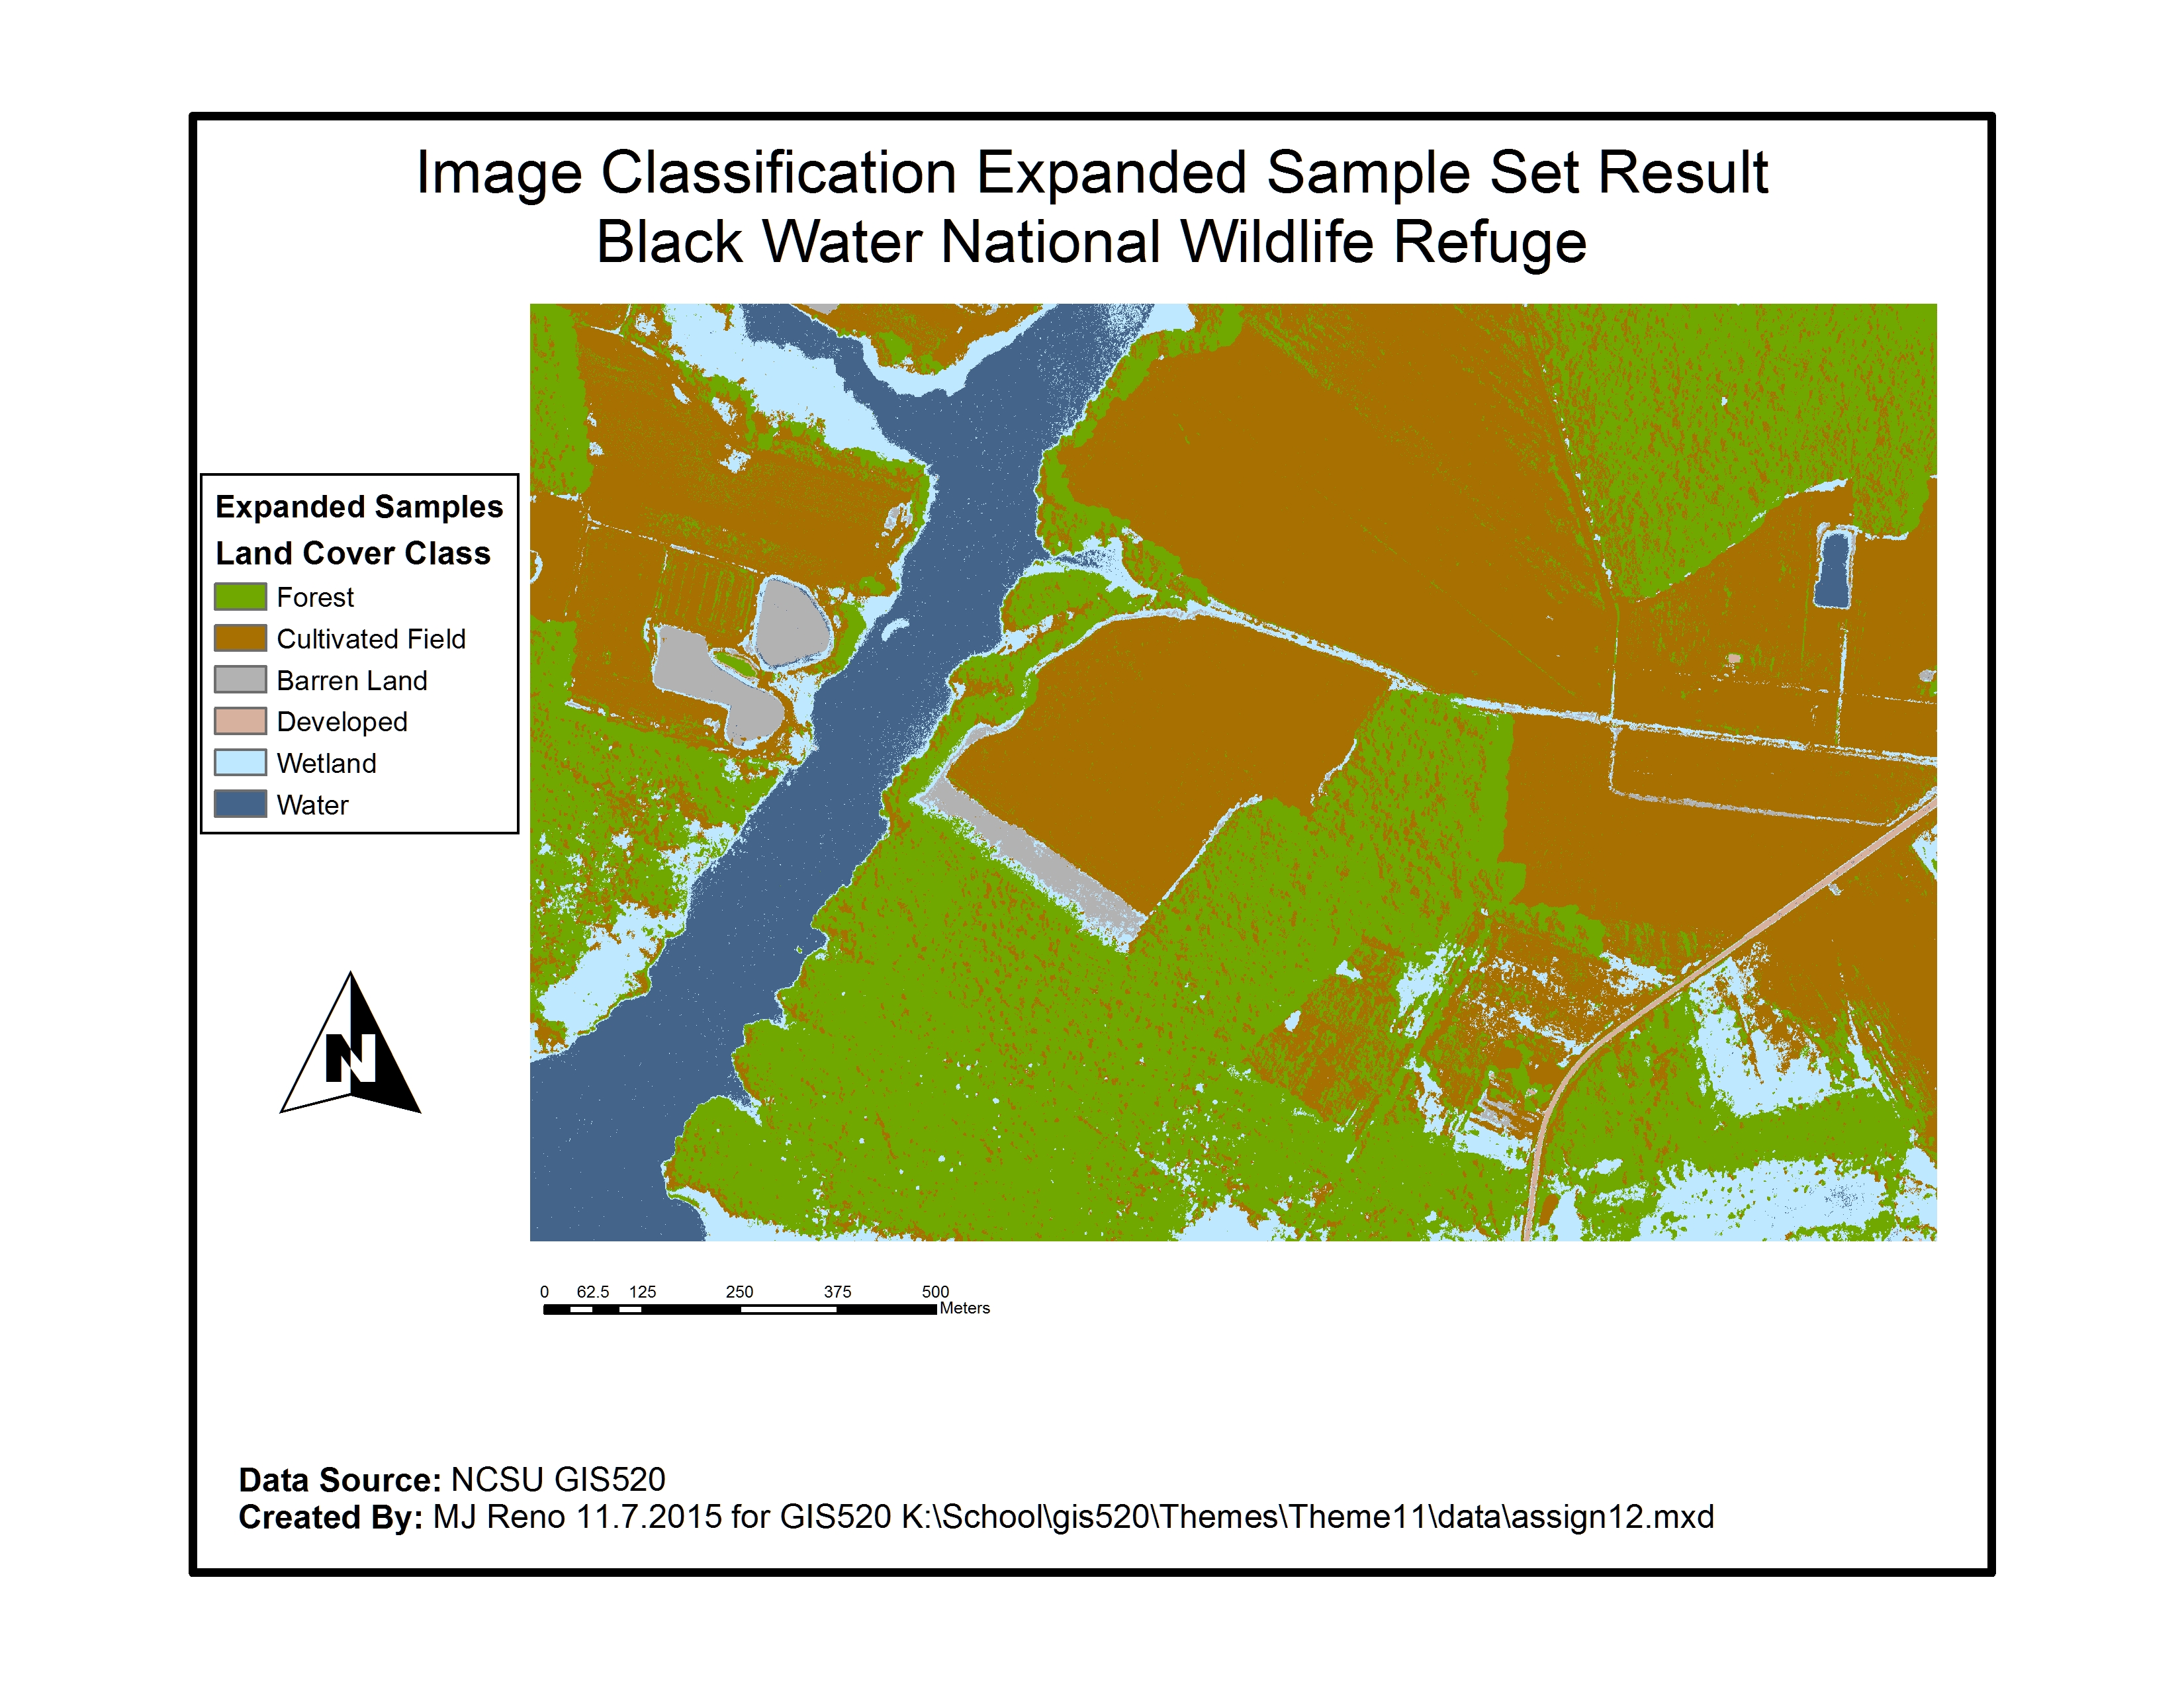
Methods: The tif file was imported into ArcMap and prepared for the classification. The image was set up as color-infrared by setting Red to Band 4, Green to Band 3 and Blue to Band 2. Initially cover type training samples were restricted to 2 per type. The temporary classification resulting from the initial supervised classification was exported as a Grid file, and added as a layer to the map. This layer was then used to characterize the results of the classification by calculating the area of each type. Each cell in the source file has 0.3m x 0.3m dimensions and thus the per type cell count was multiplied by (0.3 x 0.3)m2 for area comparison. The restricted sample set generated the following areas (m2): forest = 1018555.29, field = 665167.77, barren = 41393.34, developed = 31267.98, wetland = 185230.17, water = 218385.45. Next, training sample sets were expanded for cover types that had significant misclassifications. This process was iterative and required multiple additions of training samples especially for the forest and field types. These types contained significant diversity within them and samples covering that diversity were added. After the final supervised classification the following areas were observed (m2): forest = 760287.42, field = 944721.45, barren = 34627.95, developed = 5612.49, wetland = 191490.84, water = 223259.85. The results show that areas with greater homogeny (e.g. water) are more similar however areas with significant diversity (forest, field) have shifted more. These results can readily be observed in the generated maps.
Results
Restricted Sample Set:

Image Classification Result based on Restricted Samples:
Extended Sample Set:
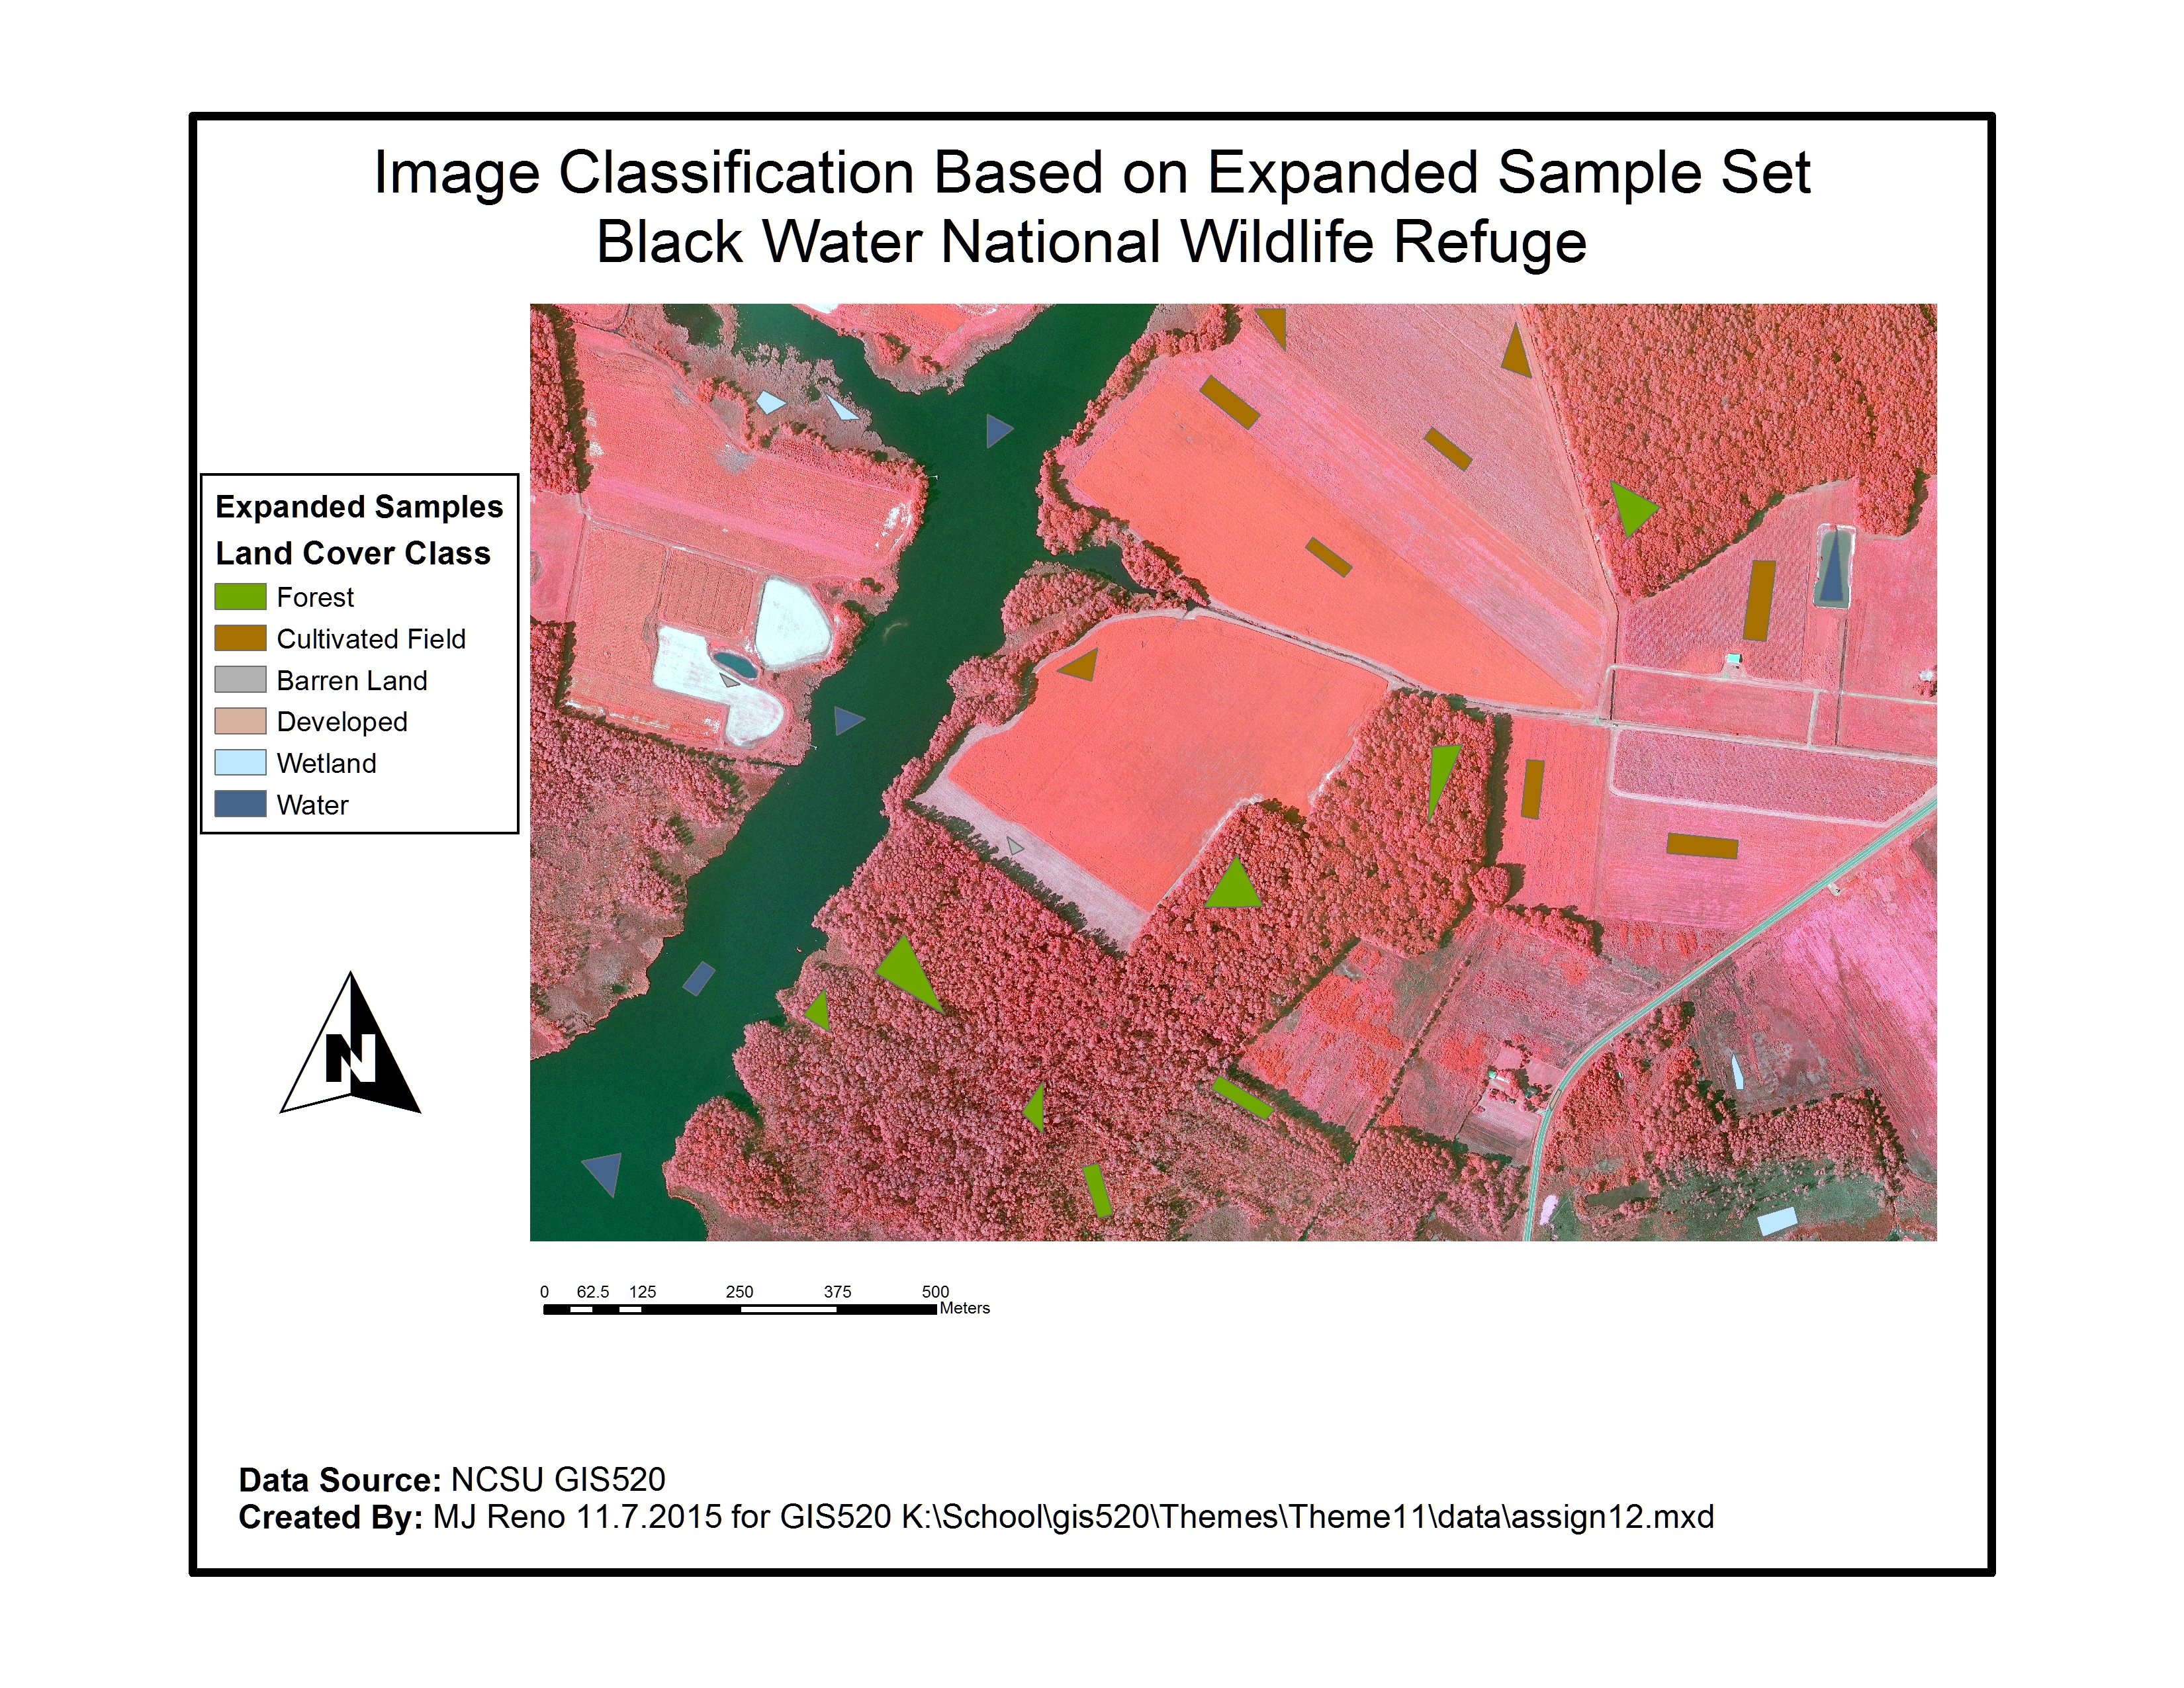
Image Classification Result based on Extended Samples:
Application and Reflection
Problem Description: Consider a development project that initially needs to zone a large tract of land into parcels for single lot home construction.
Data Needed: Multi-band aerial image of entire area.
Analysis Procedures: A multi-band aerial image is taken of the entire land area and the image is classified to show streams, wooded areas, wetlands and open areas. This information is a starting point for zoning lots relative to non-negotiable natural features (the streams) as well as features to some degree would be preserved (woods) to enhance the appeal of the area.