Problem
Although maps convey some level of implicit meaning due to their visual nature, often deeper levels of analysis are required to quantify patterns to be able to precisely answer questions. There are many statistical techniques available to use on map associated data and tools are often packaged with geographic information systems to apply the most common ones. The Fort Worth fire department has asked for assistance in applying statistical analysis on data they have collected that includes emergency service calls (including priority) locations relative to existing and proposed stations. In particular, they would like to know if EMS calls tend to cluster, if high priority calls tend to cluster, and at what distance the densities of calls per block cluster.
Analysis procedures
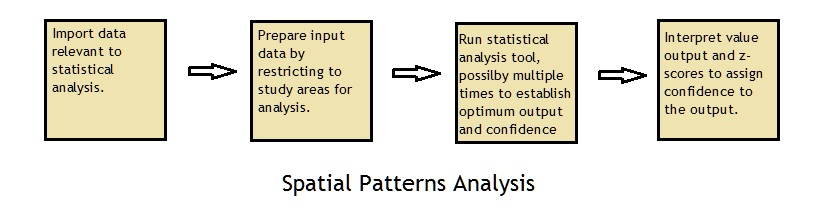
Strategies: These problems were all solved using ArcMap spatial statistics tools. The general workflow was to identify input data and created definition queries where necessary to restrict the input to relevant data subsets. The relevant tool was then used on the input data, possibly using multiple runs while varying input parameters in order to identify where the statistically significant trends and confidences were. The output data was considered on multiple criteria including the calculated values but also p-values and z-scores in order to assign confidences in results generated.
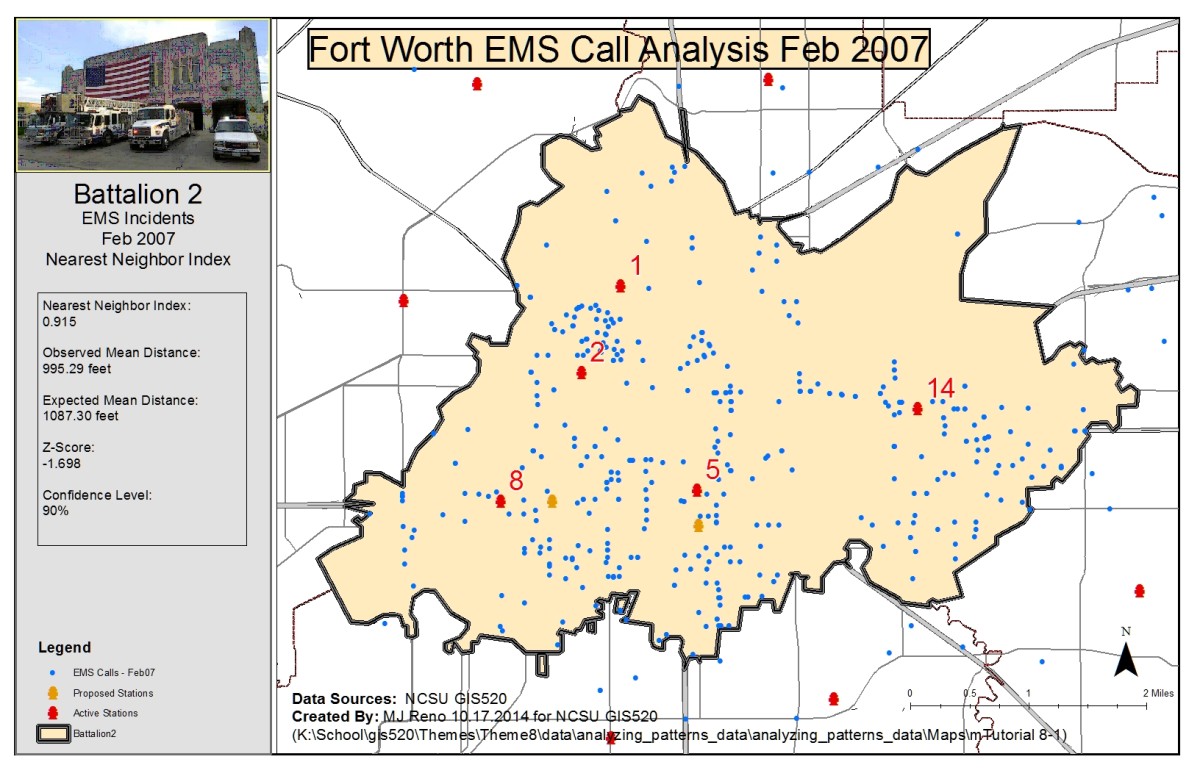
Methods: The first question addressed to consider whether Fort Worth emergency call data showed a tendency to cluster in the Battalion 2 region. For this question the Average Nearest Neighbor tool was used, which generates an index based on the nearest neighbor to each feature in an area. The input data was the EMS Calls-Jan 07 dataset and the area of the region which was already defined in the Battalion2 layer. The tool calculated a nearest neighbor index of 0.915 at a mean distance of 995.29 feet (expected 1087.30), however the confidence level was only 90%.
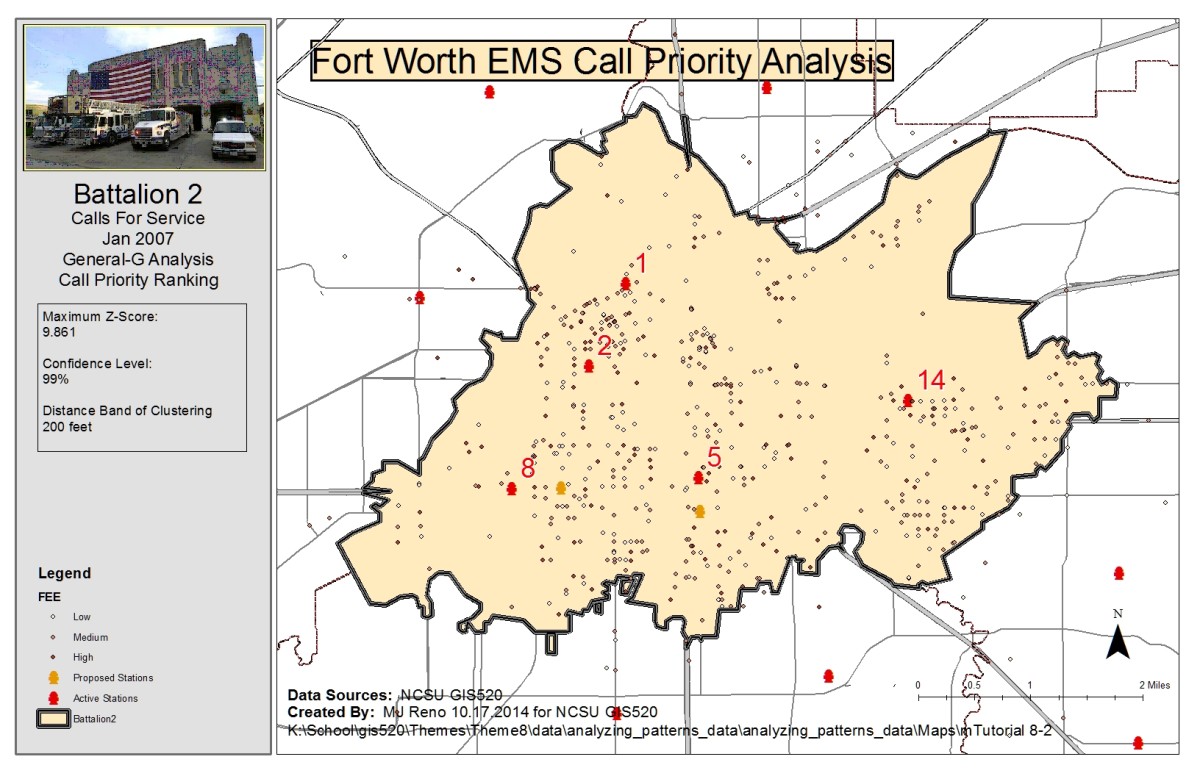
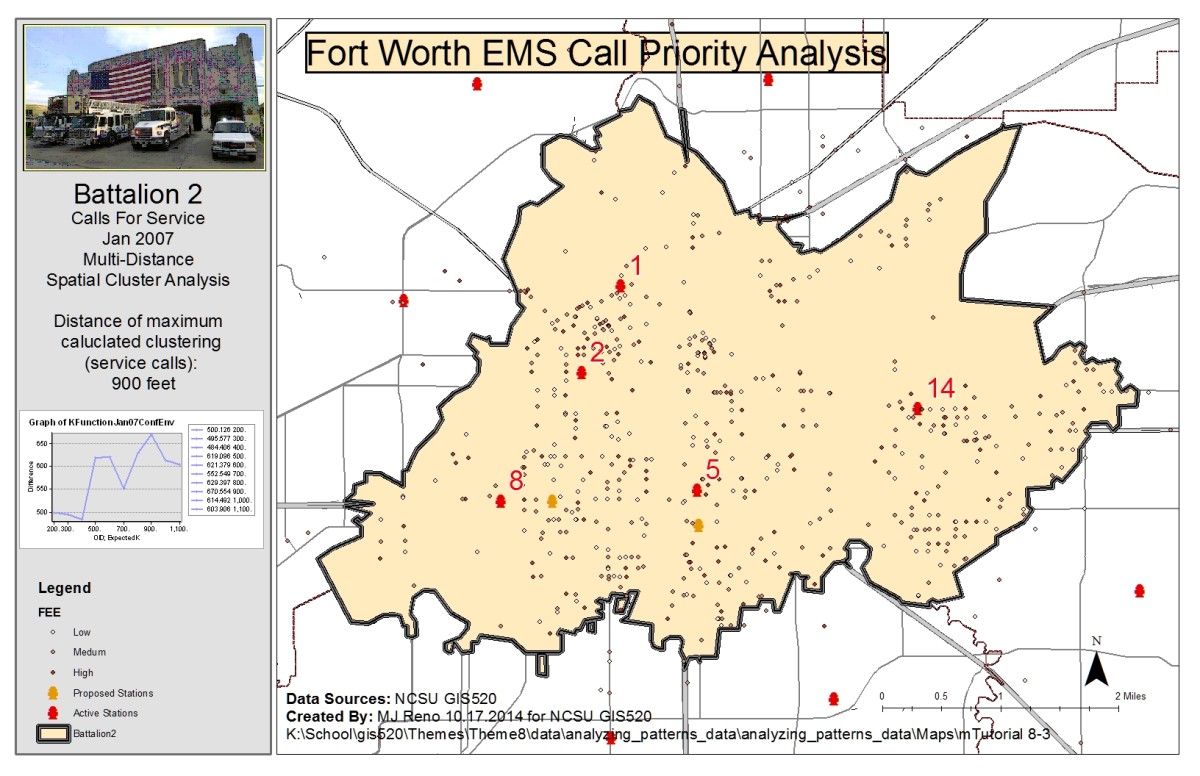
The second question addressed was again related to the clustering of emergency calls however this time the priority of calls was considered as well as the clustering distance. Analysis related to this question was done with two different tools, first the Getis-Ord General G tool and then the Multi-distance spatial cluster analysis tool (Ripley’s K function). First, the Calculate Distance Band tool was used to determine the min, max and average distances at which the features (calls) could find at least 7 neighbors. The average distance was close to 1000 feet and so distances above and below this value were considered as input distances for the tools. Inputs for the Getis-Ord General G tool were chosen at 200 foot increments from 200 to 1200 feet. The distance band of clustering was determined to be 200 feet with a maximum z-score of 9.861 which gives a 99% confidence in rejecting the null hypothesis of random distribution of calls considering priority. The Multi-Distance Spatial Cluster tool was run on imputs ranging from 200 to 1200 feet at distance increments of 100 feet. The tool was run with a confidence envelope of 99 permutations. The distance of maximum clustering was found by calculating the difference between the observed K index and the confidence envelope upper limit, shown below as the Difference attribute. The maximum clustering calculated distance was found to be 900 feet.
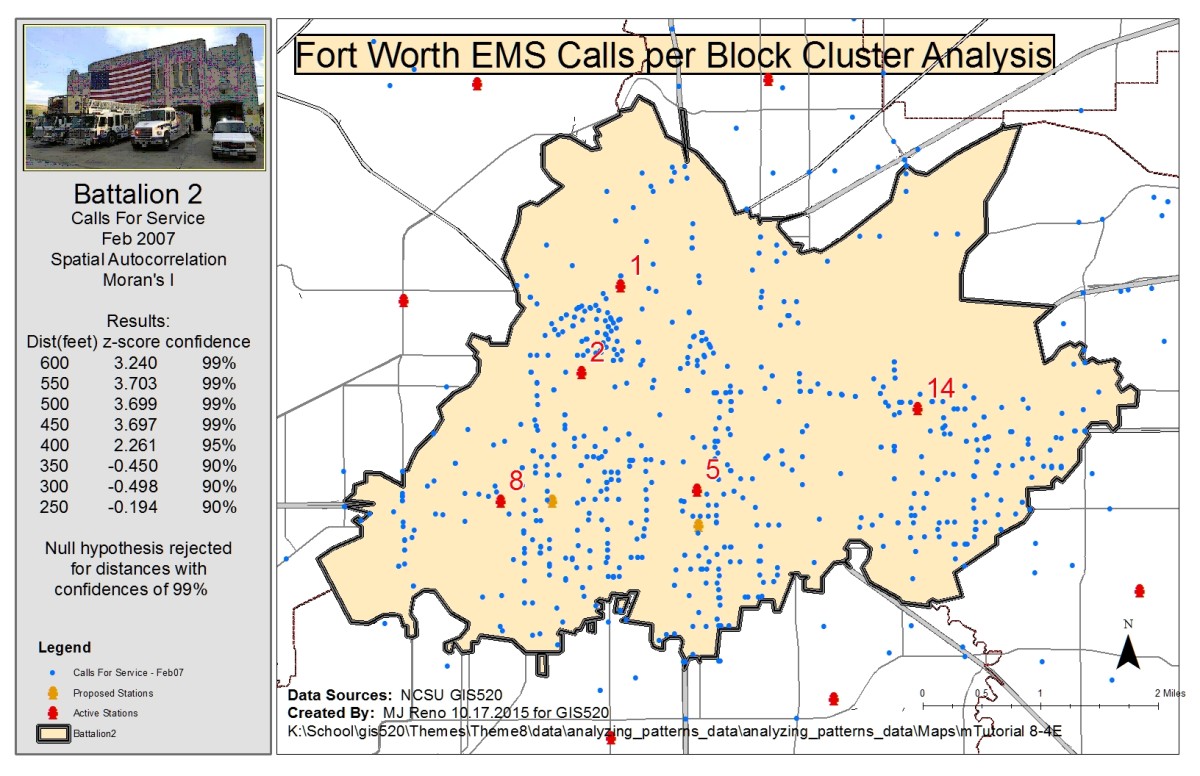
Finally, call per block densities were considered to determine at what distance these densities clustered. For this analysis the Spatial Autocorrelations tool was used. First, a 200×200 foot grid was used to calculate densities of calls per block using the spatial join tool. Once densities were determined, a Definition Query was set for the generated layer to show only blocks with a call density of greater than zero. The count value, which represented the number of calls in a particular block, was used by the tool to generate Moran’s I values for distances from 250 to 600 feet at 50 foot increments. The z-scores correlated for high 99% confidences for distances from 450 to 600 feet, with the highest z-score of 3.703 at 550 feet. This data strongly suggests that calls for service are not randomly distributed among city blocks, refuting the null hypothesis.
Results
Average Nearest Neighbor Call Analysis:
Getis-Ord General G Clustering Analysis:
Multi-distance spatial Clustering analysis:
Spatial Autocorrelations Analysis:
Application and Reflection
Problem Description: Another theoretical use of clustering analysis is to statistically analyze the nesting habits of wildlife species, for example a particular bird. Consider a wildlife biologist who has made observations and now has some theories about relationships amongst a particular species (or inter-species) of bird.
Data Needed: An exhaustive study is done over a period of years to track nesting patterns of the birds over a well-known nesting region.
Analysis Procedures: Cluster analysis is done on the nest sites to determine whether the nests are randomly distributed across the area or if, in alignment with the hypothesis, they are clustered, perhaps not only spatially but relative to some other environmental attribute.