Problem
Many civil infrastructure related problems involve the management of either naturally occurring or human made linear networks of various types. Examples include river systems, railroad and road networks and public utility line networks. Each linear feature may have multiple attributes associated with it that ideally would be analyzed in conjunction with each other. Furthermore, the attributes are often relevant to the linear structure itself and not necessarily the greater geographic context. These characteristics led to the development of linear referencing in GIS, which track attribute events along the length of the linear feature relative to some origin point in the feature itself as opposed to a coordinate in the greater geographic context.
Analysis procedures
Strategies: This assignment explores linear referencing tools and work flows in ArcGIS. ArcCatalog is first used to explore linear feature classes that will be used for linear referencing exercises. A linear feature class, made up of traffic routes, is then used to do some basic linear referencing analysis. An accident route event layer is created, followed by a route event layer that describes road conditions, among other attributes. The event layers and intersected to try to address whether accidents seem to be correlated with the road quality for a particular section of the route.
Methods: In this exercise event layers are generated from event tables and overlaid on a polyline feature class to visually represent the locations of those events and for analysis. The polyline feature class represents traffic routes. The input tabular event tables describe the locations of accidents (point events with multiple other attributes that describe each accident) and also an event layer which breaks the route into sections of road with attributes for that section including condition. Each event table is used to generate a Route Event Layer (using the ArcMap Route Event Layer tool) and is overlaid on the route feature for visual inspection. The event tables were then intersected using the Overlay Route Events tool. This operation generates a new event table which results in the association of each accident point event with its surrounding pavement polyline section. The resulting event table was used to generate a new Route Event layer which was used to analyze accident information in the context of the pavement attributes that it is associated with. In particular, the question being asked was to determine whether road condition (correlated with a pavement event attribute called “Rating”) appeared to correlate with the rate of accidents in this data. First, selections were done to split the 15 mile route into sections with a rating less than and equal to 75 and greater than 75. Next, the number of accidents was summed for each section and the accident rate calculated. This calculation showed that there were 1.7 accidents per mile for the poorer road (17 accidents in a 10 mile stretch) and 1.6 accidents per mile for the better road (8 accidents over 5 miles). The conclusion was that road condition did not appear to be a major factor.
Results
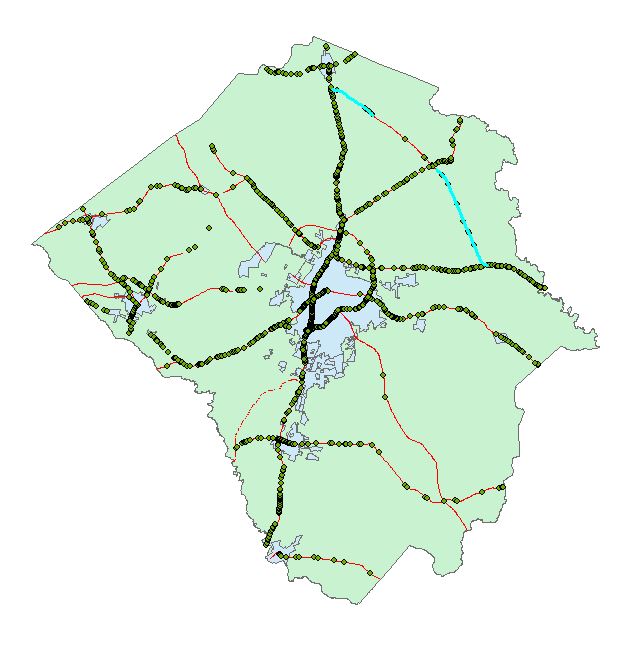
Route of Interest with lower rated section highlighted in blue and higher rated section in between:
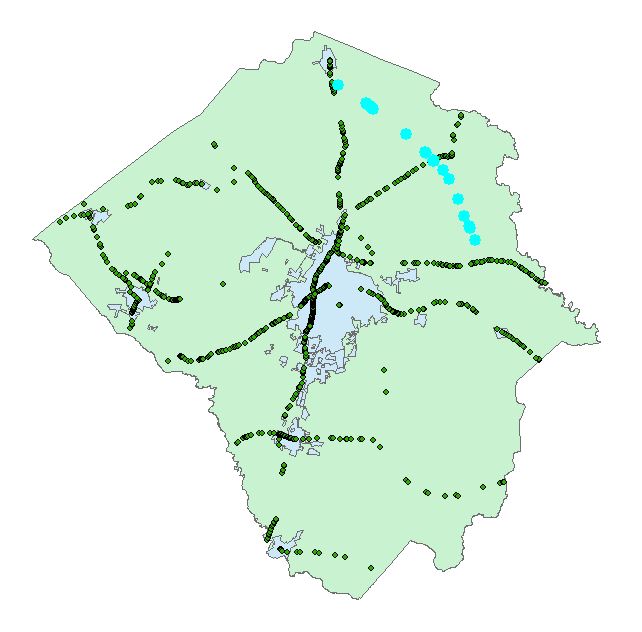
Accidents along same stretch of road:
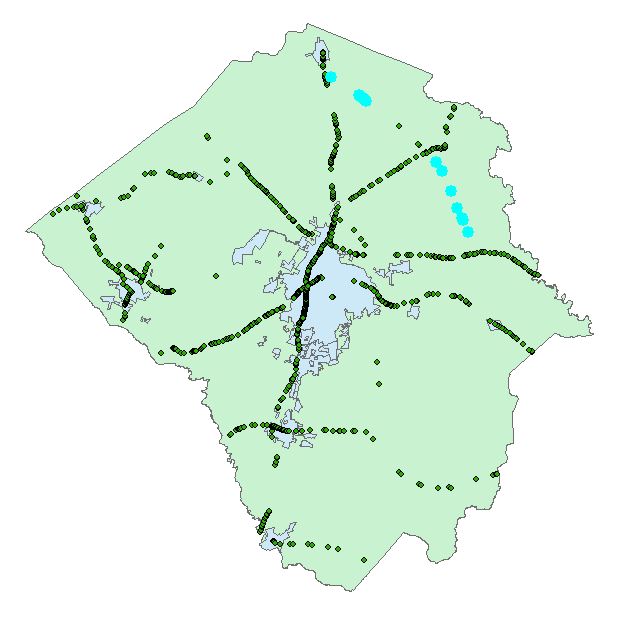
Accidents that occurred on poorer rated section of route of interest:
Application and Reflection
Problem Description: Consider utility networks that associate attributes for stretches of lines that were build or updated during a particular build cycle and maintain information such as dates of installation, types and materials used.
Data Needed: The dataset indicated above and a separate tabular dataset is maintained that tracks point events, such as outages and other adverse events, for the network.
Analysis Procedures: Intersection of the event layers could then be used for analysis on issues related to identifying priority areas for inspection and upkeep.


