Turning Data into Information Using ArcGIS 10.0 Module 1: The Influence of Sampling on Spatial Interpolation
Problem: Geographic data originates from a variety of sources and decisions must be made about what type of data to collect and how to collect and store it. These decisions must be informed by the ultimate processing and display goals but time and cost investments are also relevant. Sampling is a technique that reduces the investments made in gathering geographic data but care must be taken to determine an appropriate sampling technique for the project at hand and the right way to “interpolate”, or fill in the spaces, between the sampled data points.
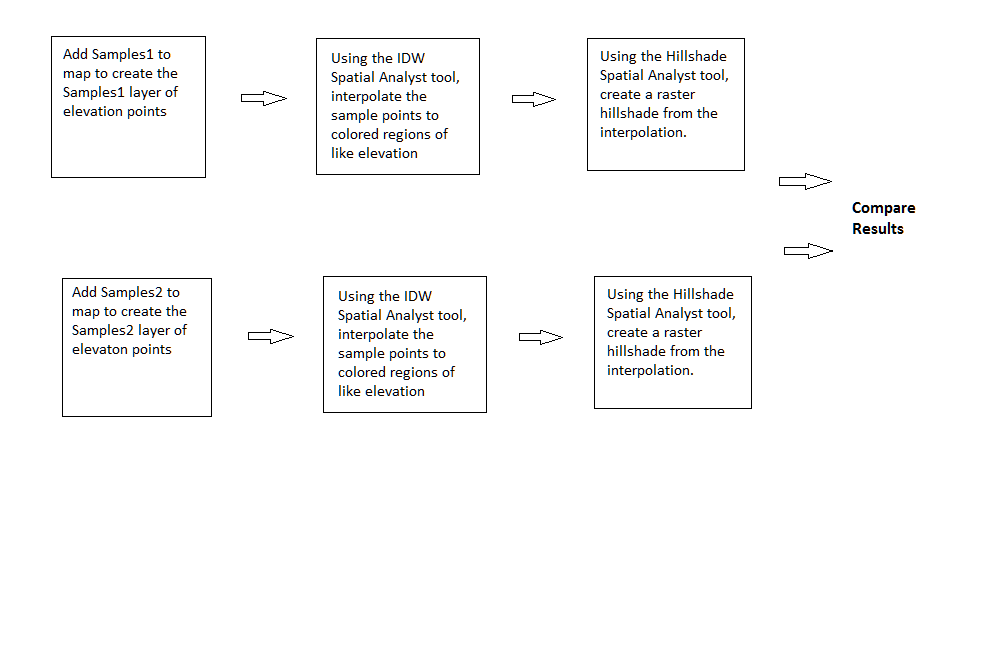
Analysis Procedures: The exercise described here demonstrates the negative impact that inappropriately choosing a sample set can have on a result. Two different sample sets are used to create hillshades of the same geographic region via interpolation. The sample points, taken from the same geographic area, are each (separately) added as a layer to the map. In each case the points describe an elevation point and are used to interpolate elevation values for the region. The IDW (Inverse Distance Weighted) tool from the ArcGIS Spatial Analyst toolset was used to interpolate the sample points to an “Elevation” layer. Each elevation layer was then converted to a “Hillshade” raster layer using the Spatial Analyst Hillshade tool. This hillshade layer output provides a good way to visually compare the topological differences in the terrain resulting from the different sample sets.
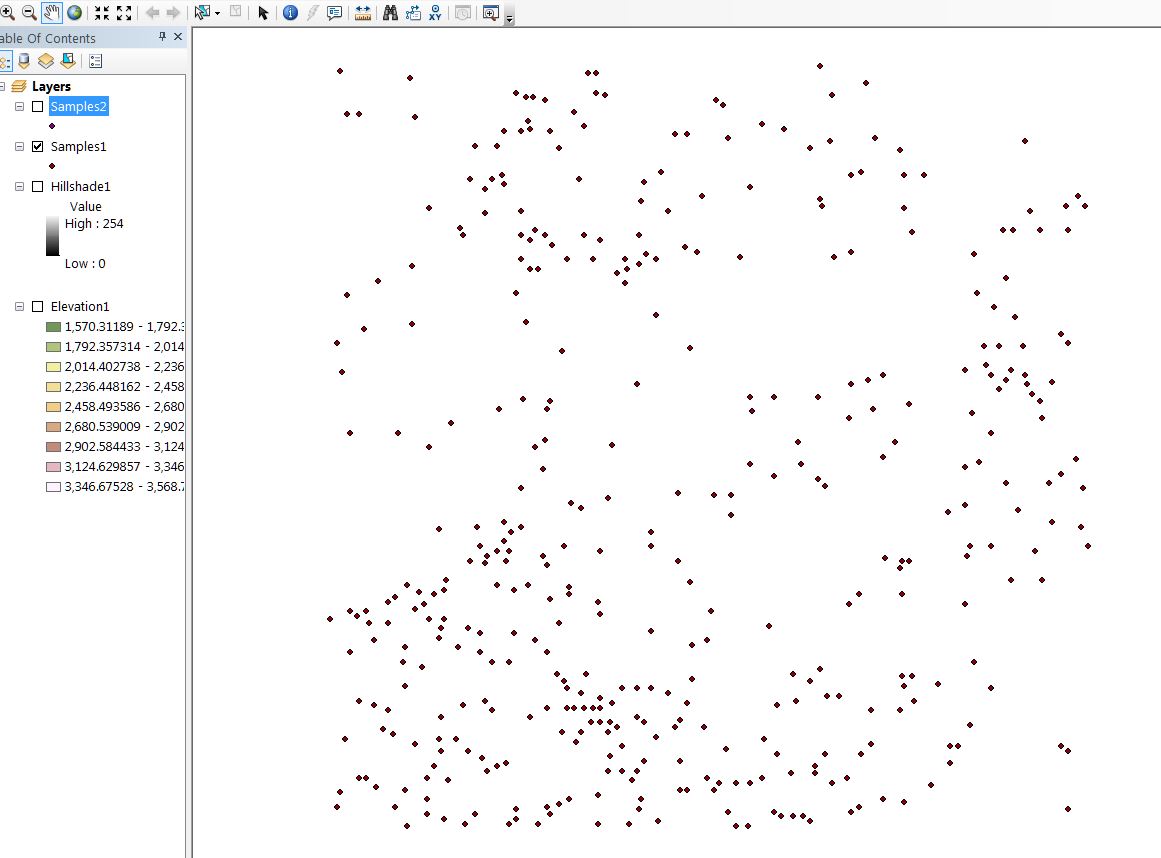
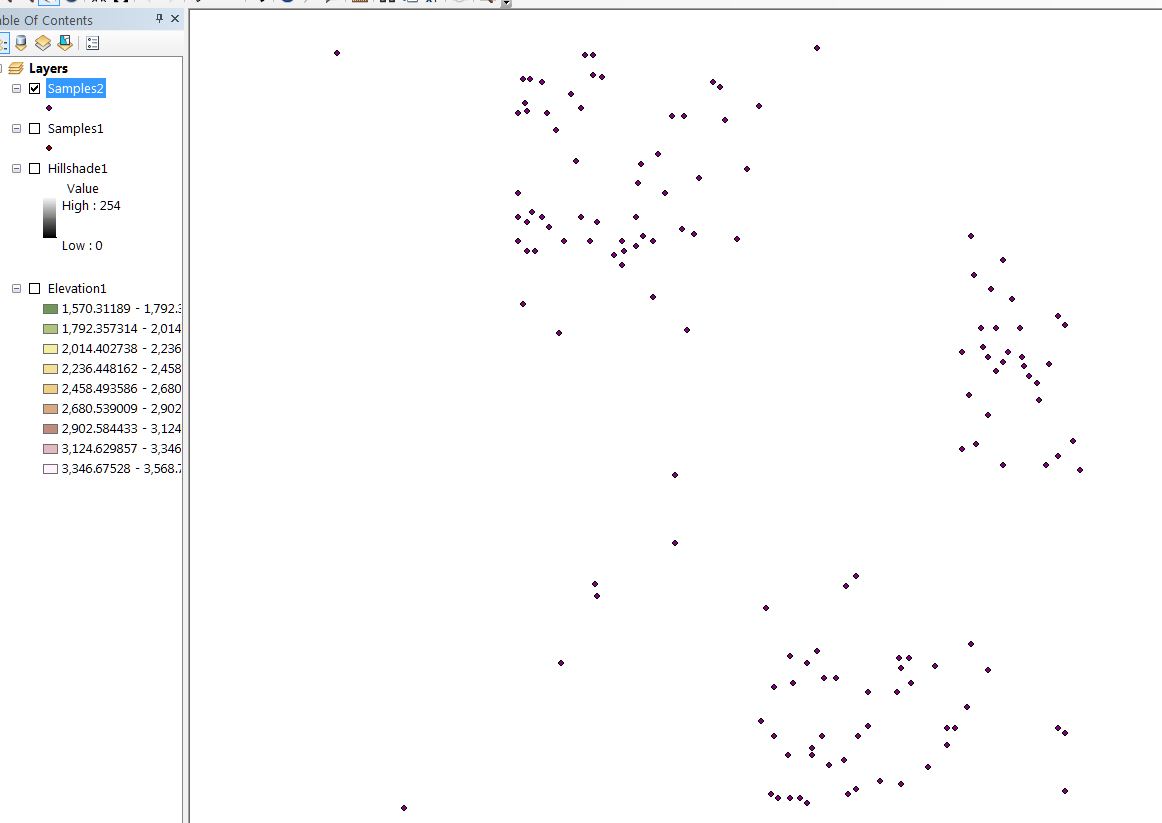
Results: The original sample sets were quite different. The distribution of Samples1 (left) clearly has broader coverage throughout the physcial area while Samples2 (right) has areas of concentrated sampling with a few outlier points beyond the sampling concentrations:
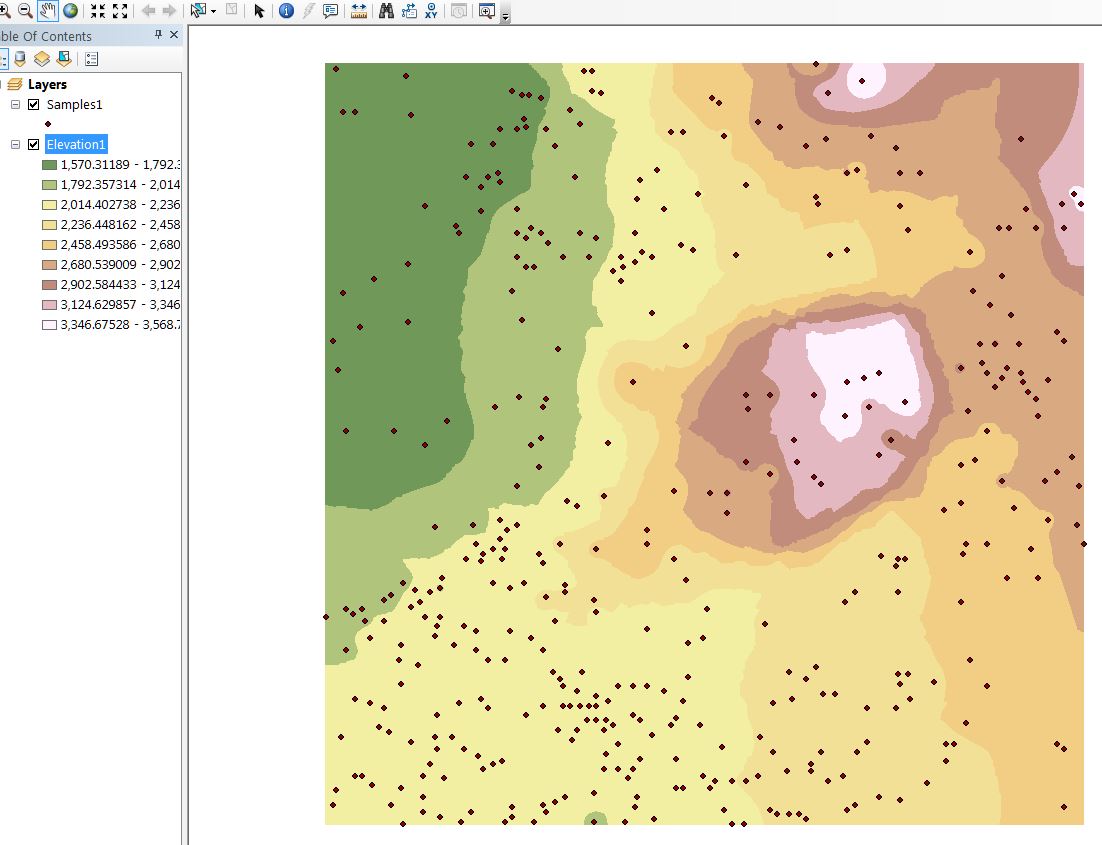
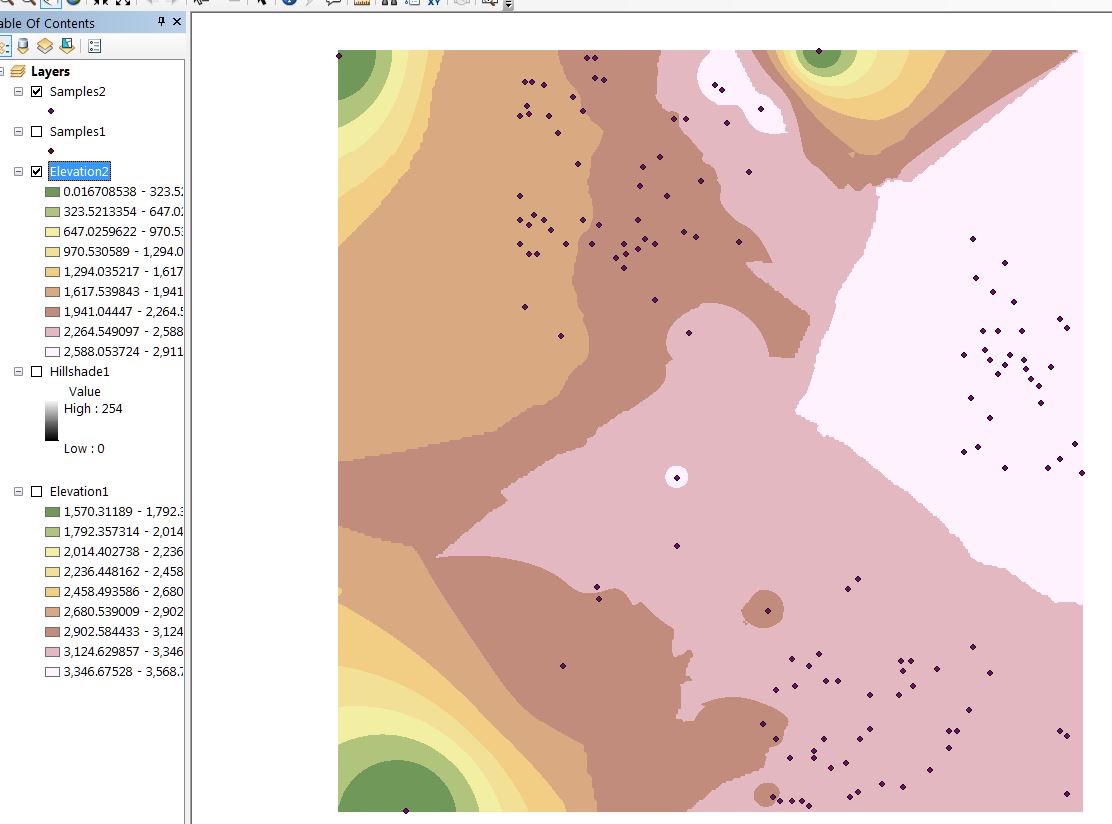
The interpolated elevation layers show significant differences in the locations and relative quantities of elevation ranges. Note in the Sample1 (left) based elevation that the upper left corner has a large amount of low-lying (green) area, and the lighter, higher elevation, areas peak in two areas- the first towards the center and the second in the upper right corner. The Samples2 (right) based interpolation shows a large high elevation area towards the right of the region sweeping downwards toward the lower and upper left corners:
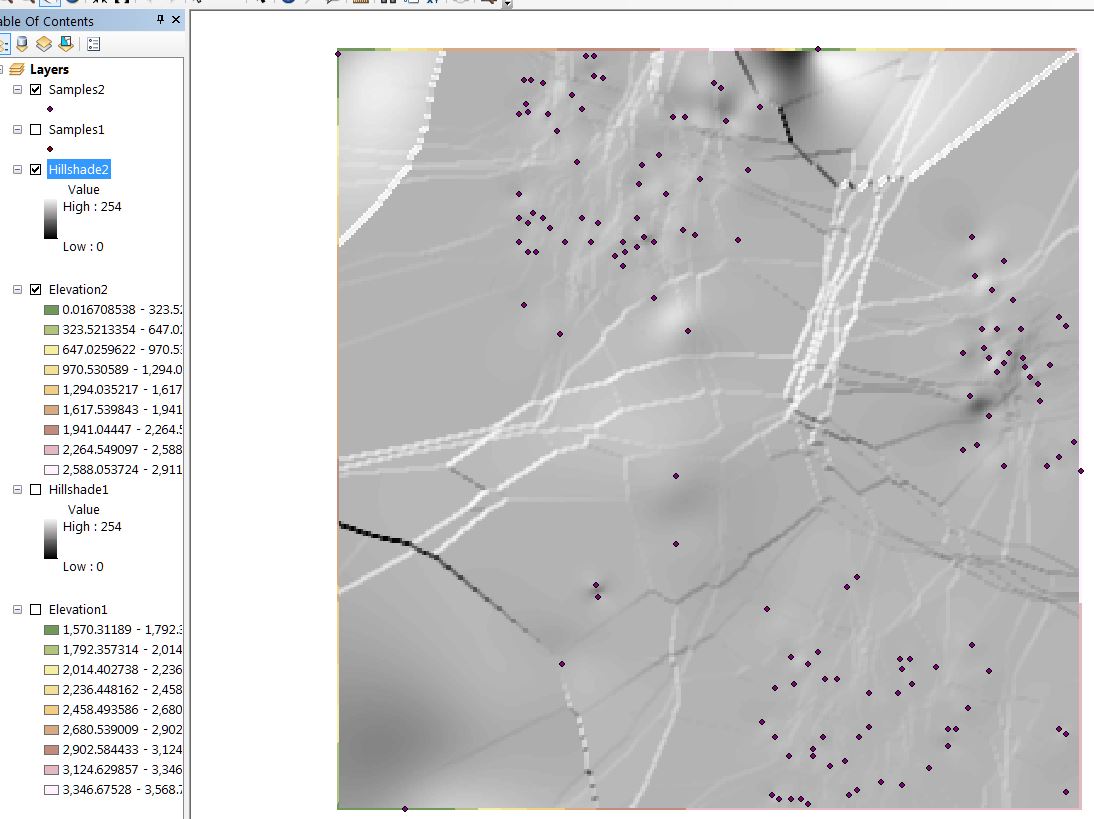
The raster hillshade layers corroborate the elevation layers shown above. Here you can readily visualize the differences as the Samples1 (left) based hillshade is a region with 2 peaks whereas the Samples2 (right) based hillshade looks more like a long slope running from right to left:

Application & Reflection
Problem description: Economically represent a city by sampling households across the area and then presenting data that gives some indication of economic prosperity or hardship and its distribution across the area.
Data needed: Household economic data such as household incomes, numbers of people in the household, household debt and household savings would be required. A distribution of household types (rental, own, subsidized, etc) and across all neighborhoods and regions.
Analysis procedures: Mining census type data may be the best way forward as much of this type of information is private and can’t be associated with individual households. It would be my expectation that many households in a given neighborhood would share in common some economic characteristics. Neighborhoods themselves may differ considerably one to another. Each neighborhood would be sampled at a particular rate (say 1 sample for each 50 households) and regions outside of neighborhoods would be divided into geographic areas and sampled at an higher rate (say 1 in 20 if possible) as I would expect these sorts of areas to show more diversity.